C5.1 Sampling techniques are used to estimate population size.
C5.2 The exponential growth pattern occurs in an ideal, unlimited environment.
C5.3 Population growth slows as a population reaches the carrying capacity of the environment.
C5.4 The phases shown in the sigmoid curve can be explained by relative rates of natality, mortality, immigration and emigration.
C5.5 Limiting factors can be top down or bottom up.
Source: Chapter C and Chapter 4 ecology notes. pdf, power point AHL population ecology and Biology: Oxford IB Diploma Programme book.
estimating population size
The simplest method of estimating population size or population density is to count the number of individuals in a given area. We can only do this when the individuals are large and the area is small.
For other cases we use the population sampling techniques. This requires the researcher to determine the population size in a small area and use this to estimate the entire population. This is referred to as population sampling.The sample that you take is assumed to be representative of the entire population. Sampling techniques must be appropriate to the community being studied and the information required by the investigator. Sampling techniques include: point sampling, Transect, quadrat sampling, mark and recapture.
Methods of determining population size
-The "J" shaped population growth curve. The exponential growth pattern occurs in an ideal unlimited environment.
If a population experiences ideal condition than the population will grow exponentially. A graph of population size over time will resemble a "J" shape.
-The "S" shape growth curve is called sigmoid. The s-curve is representative of what happens when a population colonizes a new habitat. The population will grow exponentially at the beginning, as the environment begins to offer resistance, the population reaches a transition point, where the growth rate begins to slow down until it reaches the carrying capacity.
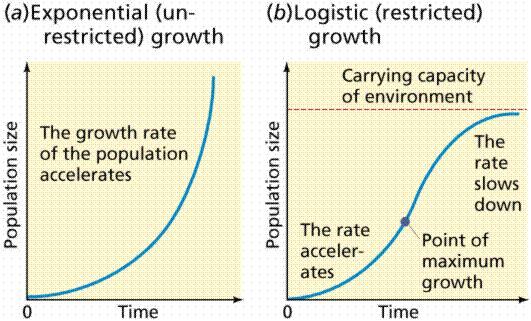
Logistic growth curve
•Exponential growth phase
–Species doubles per unit time
–No limiting factors: nutrients, oxygen, space in ample supply
• Transitional phase
–Population growth continues but at a slower rate
–Limiting factors slow growth rate: nutrients, oxygen, space in short supply
•Plateau phase
–Population growth slows to zero
–Limiting factors inhibit population growth: nutrients, oxygen, space in short supply
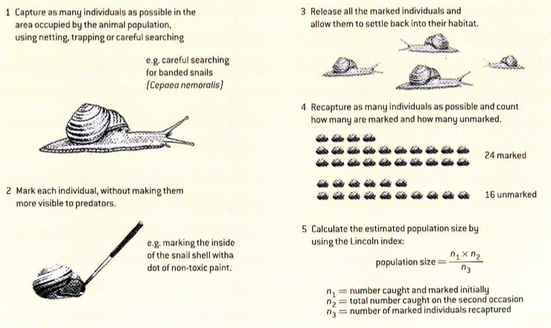
sampling techniques
the lincoln index
The use of the capture-mark-release-recapture method to estimate the size of an animal species.
This is one type of sampling techniques used to determine populations density.
This is one type of sampling techniques used to determine populations density.
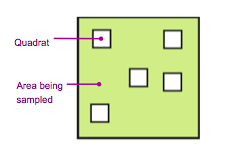
quadrat sampling
Quadrat sampling is a method by which organisms in a certain set proportion (sample) of the habitat are counted or measured directly.
It can be used to determine community and population composition, including abundance, species density and distribution, frequency of occurrence, percentage cover (of plants) and biomass (if harvested).
Quadrats may be used without a transect when studying a relatively uniform habitat. The quadrat positions are chosen randomly using a random number table.
Steps:
1. The area of each quadrat must be known exactly.
2.Enough quadrat samples must be taken to provide results that are representative of the total population in the area.
3.Count or measurement procedure must be decided beforehand and species must be distinguishable from each other
4.The size of the quadrat should be appropriate to the organisms and habitat, e.g. large for trees, small for leaf litter.
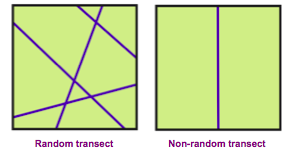
line transects
A line transect is a sampling line placed across a community. Transects are used to determine changes in community composition (species distribution) along an environmental gradient. Line transects are drawn across a map, and organisms occurring along the line are sampled.
A line transect uses a tape or rope to mark the line, and the species occurring on the line are recorded. The line(s) can be chosen
randomly, or may follow an environmental gradient (such as a rise in altitude).
A line transect uses a tape or rope to mark the line, and the species occurring on the line are recorded. The line(s) can be chosen
randomly, or may follow an environmental gradient (such as a rise in altitude).
factors that influence population size
-The phases shown in the sigmoid curve can be explained by relative rates of natality, mortality, immigration and emigration.
-With limited environmental resistance, a population will grow exponentially. At this stage birth rate (natality) is higher than death rate (mortality). When a population density increases there are various density-dependent factors that begin to limit population growth. e.g: competition for resources. The initial result is that natality slows in relation to mortality (transition phase on the curve), it is important to mention that the population is still growing at this moment. The plateau phase begins when mortality and natality rates are equal.
-Migration is a variable that affects population size, immigration increases the size of a population and emigration decreases it. Emigration occurs when population members leave an area.
Definitions:
•Natality: birth rate
•Immigration: rate at which individuals move into a population
•Mortality: death rate
•Emigration: rate at which individuals move out of the population
•P = (N + I) – (M + E)
carrying capacity
The maximum size of a population that an environment ca support (Population growth slows as a population reaches the carrying capacity of an environment). In the sigmoid curve, when a population reaches carrying capacity, it means that natality and mortality are equal and the population will stop growing. It is called the plateau phase.
Limiting factors that contribute to the Carrying Capacity (K)
•density-dependent, biotic factors:
–mortality due to disease
–mortality due to predation
–intra specific competition
•density-independent, abiotic factors:
–mortality due to weather
–mortality due to natural disasters: fire, hurricane, floods, earthquakes
Also...
-Food and water availability
-Territory and space
-Availability for mates
-Environmental change
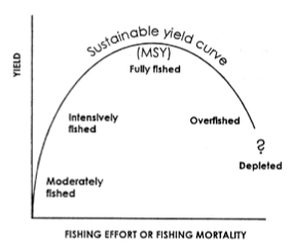
methods to determine population size of fishes
|
•Estimating commercial fish populations
–Volume of catch (tonnes) –Catch rate (per unit effort) –Catch rate by age of fish (measured by length) •It’s difficult to count as fish are highly mobile species •Estimate fish population based on fish stock. –Count number of fish of each age –Calculate spawning rate Sustainable fishing practices: •Restrictions: –Regulations on catching young fish –Agreed quotas for fish with low stock –Closed seasons to allow undisturbed breeding –Banned fishing practice (e.g. drift nets) which catch many species other than target |
|
top-down and bottom-up limiting factors
Limiting factors can be top-down or bottom-up. they are an environmental selection pressure that limits population growth.
-Bottom-up: the population organisms in an ecosystems can be influenced by the availability of resources as nutrients, food and space
-Top-down: Predation. A way to stop top-down influence is to prevent species at lower trophic levels from monopolizing critical resources such as competition, space or food.
Guidance/International mindedness/Theory of Knowledge
International-mindedness:
The issues around the growing global human population are of international concern regardless of different growth rates in different countries.
UNDERSTANDING
- Sampling techniques are used to estimate population size
- The exponential growth pattern occurs in an ideal, unlimited environment
- Population growth slows as a population reaches the carrying capacity of the environment
- The phases shown in the sigmoid curve can be explained by relative rates of natality, mortality, immigration and emigration
- Limiting factos can be top-down or bottom-up
APPLICATIONS
-Evaluating the methods used to estimate the size of commercial stock of marine resources
- Use the capture-mark-release-recapture ethos to estimate the populate size of an animal species
- Discussion of the effect of natality, mortality, immigration and emigration on population size.
- Analysis of the effect of population size, age and reproductive status on sustainable fishing practices.
- Bottom-up control of algal blooms by shortage of nutrients and top-down control by herbivory
SKILLS
- Modeling the growth curving using a simple organism such as yeast or species of Lemma
